Experiment Engine · 0:52
Mini app test results and feature revenue
Read the results of a Bundle Builder test and a Quantity Breaks test: orders with the feature, share of orders and feature revenue. Demo data.

Screens that show results use demo store data, labeled in the video.
Chapters
Transcript
0:03 A bundle test
A test of a mini app has the usual verdict, and the table of results. Here, Version B earns more revenue per visitor than the original.
0:13 Bundle impact
Bundle impact counts the orders with a bundle, and each version's share of orders. Bundle revenue is what those lines earned, after discounts and refunds. The main table also shows visitors, orders, conversion rate and average order value for each version.
0:32 Quantity Breaks
A Quantity Breaks test has the same layout, with its own impact table.
0:38 The numbers
The main table and the chart below it show the main goal for every version. In this video these numbers are demo store data.
More video tutorials
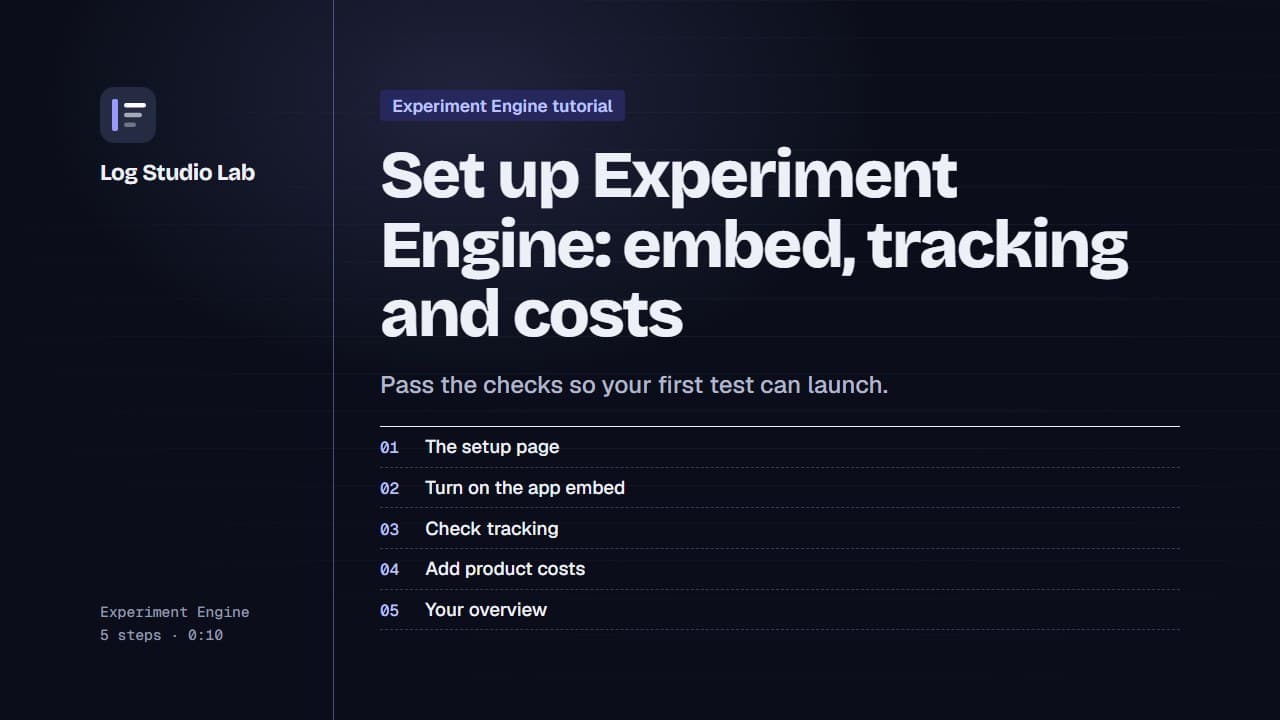
Set up Experiment Engine: embed, tracking and costs
Walk through the Experiment Engine setup page: turn on the app embed, check tracking, add product costs and find your overview.
0:58
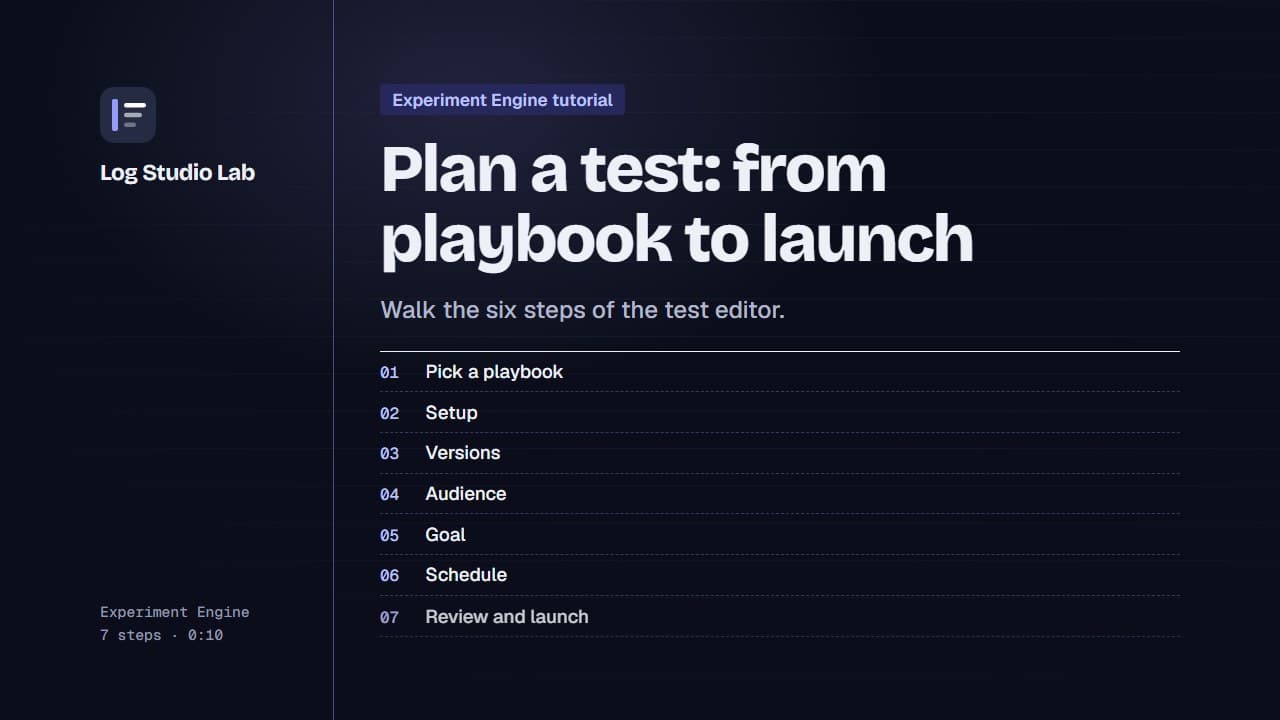
Plan a test: from playbook to launch
Pick a playbook, then walk the six steps of the test editor: setup, versions, audience, goal, schedule and review.
1:10
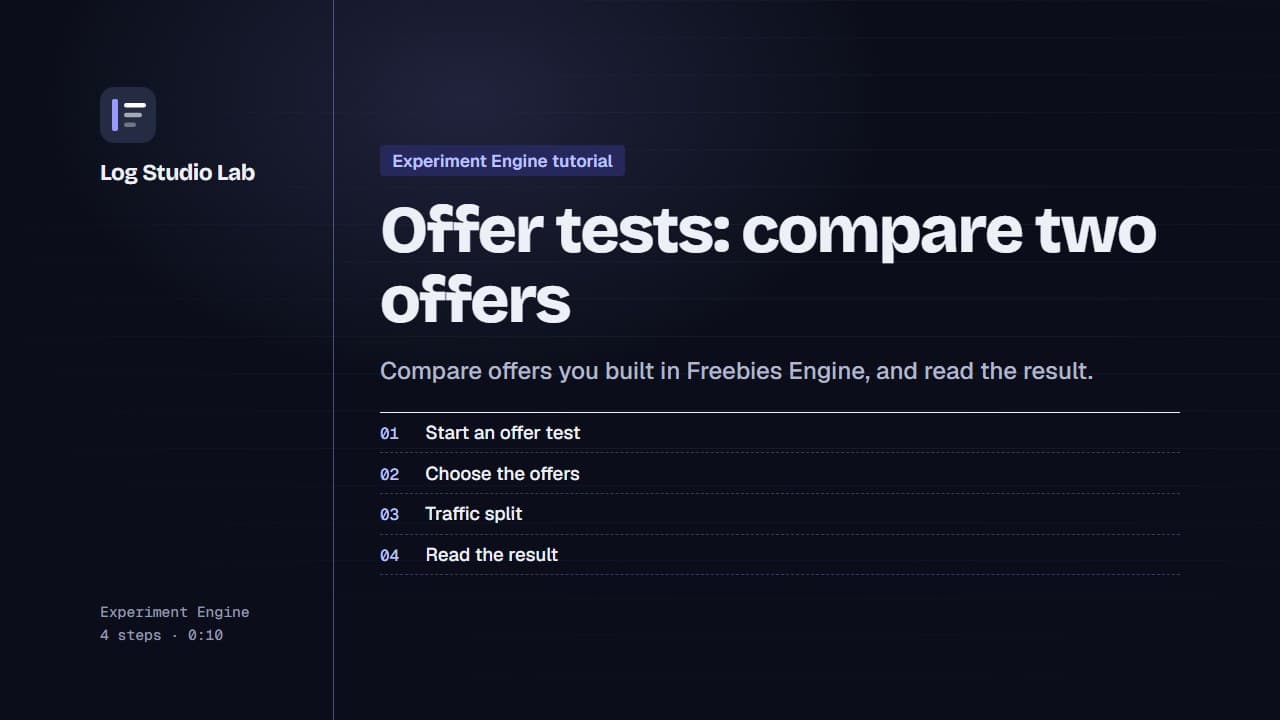
Offer tests: compare two offers
Set up an offer test to compare offers from Freebies Engine, or one offer against none, then read the result. Results shown with demo store data.
0:55